Average order value up 50.5%, returns-adjusted, in six months.
A UK-based Shopify retailer · Shopify Advanced · six-month CRO programme
Six months into the CRO programme, the store's average order is 50.5% larger than in the same six months a year earlier — £82.87 to £124.70, net of discounts and returns (Feb–Jul 2025 against Feb–Jul 2026). Items per order moved from roughly 9.8 to roughly 14.2 across the same windows, over 15,821 orders (as at 21 August 2026 — order counts move as cancellations land).
The per-order increase is measured. What produced it is a different question. Two facts belong up front: in February 2026 — the first month of the measurement window — the client widened its volume discount tiers; and the monthly series puts the step in basket size in December 2025, before the bundle-page rebuild this study describes had shipped. Both are examined below.
The comparison runs against Feb–Jul 2025 — before the CRO programme began in January 2026. It is not a clean baseline. I was already doing small ad-hoc dev work for the client through 2025, so the comparison window contains some of my own earlier work.
What actually changed
This was a storefront rebuild, executed as a sequence — not an isolated test programme. No single change below produced the result; they are not separable.
| When | What shipped |
|---|---|
| Mar 2025 | Volume discount table on standard product pages (ad-hoc period, pre-retainer) |
| Nov 2025 | Announcement bar promoting bundles; cart and checkout changes, including volume-discount messaging in cart (retainer begins) |
| Dec 2025 | Header navigation and mobile menu rebuild; new hero. The volume discount table appears on bundle product pages in this period (between 25 Nov and 27 Dec) |
| Jan 2026 | Whole-site mobile responsiveness pass; whole-site page-speed work; collection pages rebuilt with new features (CRO programme begins) |
| Feb 2026 | Bundle product pages rebuilt; standard product pages rebuilt |
| Mar 2026 | Top-category menu expansion, new sub-collection structure |
| Apr 2026 | About Us; FAQ rebuild; Careers pages |
| Jul 2026 | Full theme A/B test — it lost. The section below is about that. |
The result, computed from the store's own order records (Feb–Jul, both years):
- Items per order: roughly 9.8 → roughly 14.2.
- Average order value: £82.87 → £124.70 (+50.5%), net of discounts and returns — the basis every figure in this piece uses.
- The realised discount rate FELL: 15.0% → 13.8% of gross. The bigger baskets were not bought with margin.
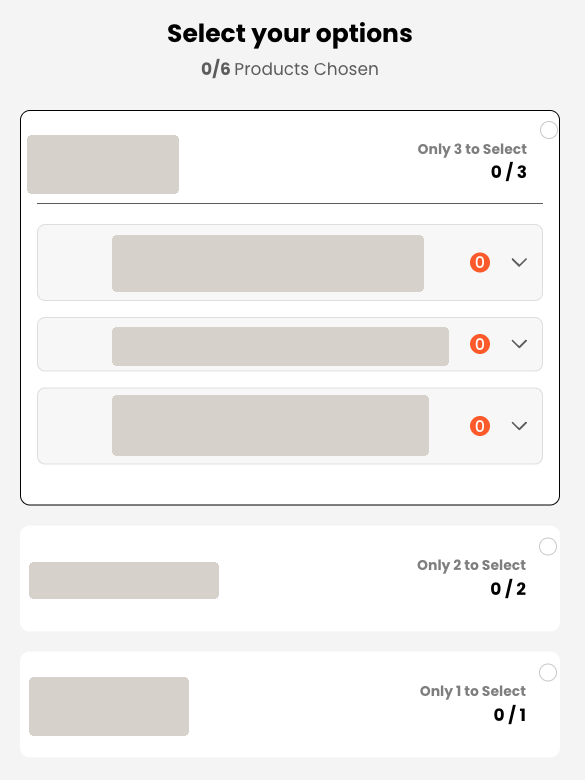
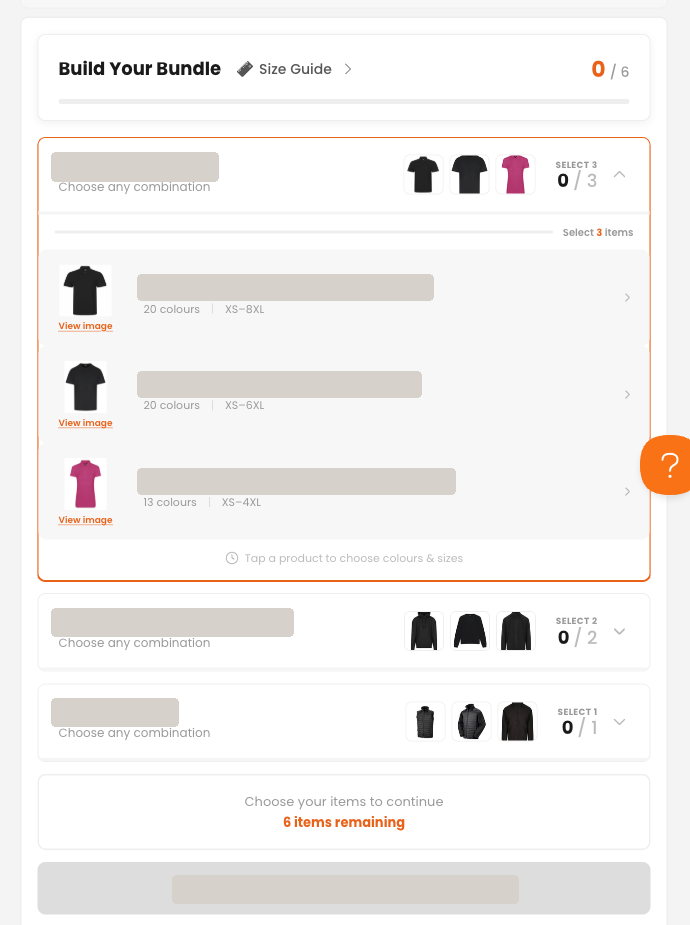
Where the growth concentrated (product-level, Jan–Jul window): a six-item bundle went from £11,965 to £268,009 (+2,140%) and an eight-item bundle from £22,643 to £250,987 (+1,008%) — the two biggest products in the store by revenue are now bundles; a year earlier both were marginal SKUs. The 24-item (+1,457%), 36-item (+493%) and 16-item (+160%) bundles moved the same direction, and optional add-on revenue scaled with it — the single largest add-on option grew +779%. Bundles didn't get a lift; they became the core of the business.
One disclosure that belongs in the body. In February 2026 — the first month of the measurement window — the client widened its volume discount tiers. The client made bulk buying cheaper, inside the window, explicitly to attract bulk orders. It is the single largest commercial change sitting alongside the storefront work.
Three things sit against it as a full explanation. Tiered volume pricing was not new — a volume discount table had been live on standard product pages since late March 2025; February changed the depth, not the existence. The realised discount rate fell over the same period, 15.0% → 13.8%, which is what you see when order volume climbs an existing ladder rather than every customer taking a deeper cut. And the storefront work was the part that put the tiers where the decision happens — the table on the product page, the messaging in the cart — which is a different job from setting them.
The offer and the storefront aren't separable here. Both are stated.
The month the baskets grew
The headline compares two six-month windows. Month by month, the movement inside them is not spread across the programme: items per order ran level through the autumn of 2025, stepped up in December 2025, and has been broadly level since. The bundle-page rebuild this study describes shipped in February 2026, two months after the step. Bundle orders had already risen to 39% of the month by January, alongside 32 new bundle products; the share settled back to the mid-twenties through the spring. Items per order held level across all of it.
December 2025 was not a bundle month. Bundle products were in 5.6% of the month's orders and accounted for 51 of its 12,796 units — 0.40%. Items per order excluding bundle products rose the same way in the same month, 9.76 to 13.04. The step happened in the part of the catalogue this study's storefront work was not about.
Three explanations I could not eliminate from the records available: a full-theme A/B test ran from 15 December 2025 to 1 January 2026, splitting traffic across two themes for most of the step month; new customers fell 71% in December 2025 — 699, against 2,440 in November — where the prior December's seasonal dip was 28%, shifting the order mix toward existing accounts; and a premises move and a change in advertising spend both fall somewhere in this period, with no date for either recoverable from the records I hold.
One explanation I could eliminate: no bundle product was created, and none was published, in October, November or December 2025. Zero. The store's new bundle products date from 3 January to 20 February 2026.
Before optimising anything: the measurement layer was broken
The first work of the CRO programme wasn't a test — it was an audit of the store's own numbers. It found them broken:
- GA4 was capturing 66.4% of real orders (Jan–Jul 2026, GA4 purchases ÷ Shopify orders) — roughly one order in three, invisible to analytics. A year earlier the same ratio was 92.1%. Measurement doesn't stay fixed; it decays while nobody watches.
- GA4 sessions ran at nearly triple Shopify's count (+199% inflation, Jan–Jul 2026; +68% a year earlier), and GA4's engagement rate fell from 83.7% to 39.6% over the same window.
Through 2025, Shopify matched between 98.8% and 100.9% of orders to the session that produced them — twelve consecutive clean months. In January 2026 that fell to 65.9%, with no ramp: December closed at 100.9%, January opened at 65.9%. Across January to July, 28.8% of orders could not be attributed to any session.
The cause was a consent-management app installed at the start of January 2026. Visitors who never interact with the banner, and those who decline, carry an unset or denied analytics state. That state has two separate effects, and the store was seeing both at once. GA4 stops recording the purchase, which is why it captured only 66.4% of orders. And Shopify honours the state at checkout while its storefront step-counting does not — so the order is recorded but the visit that produced it never attaches to it.
The orders themselves were never at risk; those are recorded server-side, and every figure in this piece comes from them. What was lost was visibility — a third of orders missing from GA4 entirely, and a third with no traceable path back to the traffic that produced them. That second one is what ad platforms train their bidding on.
By July, attribution had recovered to 86.1% on its own. The recovery is partial, and the underlying fix is scoped rather than shipped.
Every conversion decision this store might have made on its own analytics — including judging this programme — would have rested on numbers missing a third of its orders and inflating its traffic threefold. Every figure here is computed from Shopify's order records instead.
The test that lost
In July 2026 I ran a full-theme A/B test — the rebuilt theme against a new candidate. The new theme lost.
I diagnosed it rather than shelving it. Every order and abandoned checkout in the test window was checked, plus session recordings. No custom functionality was broken. The loss traced to mobile checkout price presentation: customers could tap Checkout before the total had rendered, and an £8 optional add-on charge displayed above the base item price — so the full price landed as a surprise at the worst possible moment. Four fixes are specced; relaunch recommended.
That is what a working method looks like from the inside: a controlled test, a losing variant, a diagnosis specific enough to act on, and a store that never shipped the regression.
The cost side: returns went up
Returns rose from 5.5% to 11.5% of gross (Feb–Jul, by value), with a sharp step in April 2026 — 5.3% in February, 16.2% in April, still elevated at 11.9% in July. The product-page rebuilds shipped in February; returns lag purchase by weeks; the timing is consistent with the rebuild driving larger baskets and part of the gain coming back. That is a pattern, not a proven cause.
The consequence is already priced into every number above: the +50.5% AOV movement is net of returns. Bigger baskets brought more returns, and the figures survive with that cost counted.
The relationship
- January 2025 — first contact: three small orders via Fiverr.
- Through 2025 — ad-hoc dev tasks, moved to Slack. No retainer. The volume discount table ships on standard product pages in March 2025, inside this period.
- November 2025 — the retainer begins.
- January 2026 — the CRO programme begins inside it.
Nineteen months of working relationship; the last nine on an active retainer.
If you've run CRO before and it didn't work
The most common reason isn't the tests. It's that the numbers the tests were judged on were wrong, and nobody checked first.
This store's analytics were missing a third of its orders before a single test ran. That's not unusual. It's the first thing I look at, because everything downstream is built on it.
If you run a Shopify store and you're not certain your numbers are clean, that's the conversation.
Book the audit